Hay Point & Mackay
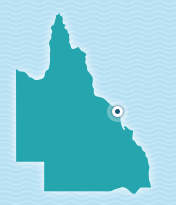
The map below shows the historical extent of seagrass presence within our monitoring areas over the past ten years. The program for the Hay Point and Mackay region has recently been transitioned to a three-year cycle, completing a large survey of inshore/coastal and offshore areas every three years and smaller surveys in the intervening years.
Like most plants, seagrass responds to changes in its surrounding environment. So we also keep track of environmental influencers such as light and temperature that may impact the distribution and condition of seagrass growing in our monitoring areas.
Many environmental influencers and events can impact the marine ecosystem. Major weather events that are particularly relevant in North Queensland are cyclones.
Cyclones typically generate extreme energy environments, with large waves and intense winds, both of which can have a strong physical impact on seagrass and their seed banks within the sediments such as burial, scouring, or direct removal of plants or seeds. Secondary impacts caused by associated high rainfall—such as changes in salinity, turbidity and nutrient levels during or leading up to the growing season—may also affect the seagrass.
The boundary of the offshore area for the Hay Point and Mackay region has changed over time however to allow comparison of all years’, the map and graphical comparisons are based on the 2004 delineated survey area. Further detail on this can be found in these reports.
-
Higher water temperatures can make it difficult for seagrass to grow. A prolonged period of time of high water temperatures during the growing season, as well as an above-average water temperature for the year, can indicate pressure on coastal seagrass condition.
Water temperature over 10 years -
Solar radiation is a way of measuring the intensity of the sun as it falls on the water surface. High solar radiation may offer benefit to seagrasses by providing more energy for photosynthesis. However, when this is coupled with extended periods of high water temperature or extended periods of daytime exposure to air at low tide, we are, likely to see seagrass come under increased pressure (see below for density charts).
Solar radiation over 10 years -
As seagrasses need light to survive, they are sensitive to any pressures that may reduce the light available to them. High rainfall can lead to increased runoff from the land, turbid water flows into coastal environments and local coastal re-suspension that result in reduced levels of light reaching the ocean floor making it difficult for seagrasses to survive. In extreme cases high rainfall and flooding can also reduce the salinity of the water which may also cause stress to seagrasses.
Rainfall over 10 years
The chart to the right shows the annual seagrass extent as a percentage of our total inshore survey area.
The location of these inshore seagrasses means that they are susceptible to environmental pressures such as high rainfall, flood plumes and high wave/wind activity. These communities are generally dominated by Holodule uninervis with Halophila ovalis and Zostera muelleri also being identified in the area. H. uninervis and Z. muelleri are more stable and persistent than other, more colonising species.
As you can see, the region has had a large number of cyclone events in the period. In the past 10 years, the highest coverage of seagrass in inshore areas of Hay Point and Mackay was in 2010 at just under seven percent, however, it has more commonly been recorded at below two percent. You may notice the reduction in seagrass extent found in instances where a growing season follows a cyclone event.
Only recently the Hay Point and Mackay program transitioned to the three-year cycle referenced above which is why you will note that some of our earlier surveys are not completed on an annual basis for inshore areas.
Seagrass density can be an important indicator of the health of a seagrass community. Denser seagrass communities can provide more complex habitat structure and protection for animals that use them as nursery grounds, and may also provide more food for turtles, dugongs and other marine animals.
In our monitoring areas, density is a representation of the above ground biomass of seagrass within each monitoring area.
As this is measured primarily using a “visual estimates of biomass” technique (Kirkman 1978; Mellors 1991), poor visibility during the survey can compromise the ability to obtain results. This is evidenced in the chart on the right, which shows annual data for each year when density surveys have been able to be completed.
Compared to the long-term average, inshore seagrasses have recorded moderate densities for majority of years, with the 2016 year boosting density to high. Recently numerous turtles have been spotted feeding amongst these inshore seagrass communities demonstrating that while meadow size is small, these inshore seagrasses continue to offer an important function to our local marine environment.
The above chart shows the extent of seagrass to not be overly impacted by the 2017 cyclone, while the density chart on the right provides more insight into the potential effects of this event.
High levels of solar radiation and daytime exposure to air at low tide can also affect density, as it may cause the seagrasses to experience temperature stress or leaves to burn.
You can see more analysis on the data in these reports. You can also download the data used to create this chart.
The chart to the right shows data only from the years when the larger surveys of deep water, offshore seagrass have been conducted; at least every three years. It shows seagrass extent as a percentage of our total offshore survey area.
The deepwater seagrasses offshore from the ports of Hay Point and Mackay are dominated by fast growing colonizing species Halophila decipiens and H. spinulosa. These seagrasses are highly seasonal and generally only present in the period between July and December. Similar to annual land plants, they are known to have an annual programmed seasonal die off and recruit the following year from seeds.
In the past 10 years, the highest coverage of seagrass within the surveyed offshore areas of the Hay Point and Mackay region was in 2014 at just under 45 percent. However, it has more commonly been recorded at less than 20 percent. The dominance of colonising species means that impact to the seedbank may have lasting effects on the capacity for the seagrass to regenerate each year.
You may notice the reduction in seagrass extent found in instances where a growing season follows a cyclone event. As you can see, the region has had a large number of cyclone events over the period. While the occurrence of cyclones during the growing season will impact the extent of growth that year, instances where cyclones occur during senescent periods may impact future year’s seagrass extent where these events cause the seed bank to be stripped.
Seagrass density can be an important indicator of the health of a seagrass community. Denser seagrass communities can provide more complex habitat structure and protection for animals that use them as nursery grounds, and may also provide more food for turtles, dugongs and other marine animals.
In our monitoring areas, density is a representation of the above ground biomass of seagrass within each monitoring area.
As noted above, these deepwater seagrasses are known to be ephemeral in nature – meaning that they have a programmed seasonal pattern of growth between July and December followed by senescence, relying on a seed bank to flourish again each year.
As is shown in the chart on the right, these offshore seagrasses are living at the margins of their natural environmental tolerances in this region and therefore consistently record low densities.
You can see more analysis on the data in these reports. You can also download the data used to create this chart.
The Keswick Island monitoring area encompasses Keswick Island and the adjacent St Bees Island. This area was added to the program in 2014 and the chart to the right shows data collected since this time. It shows seagrass extent as a percentage of our total Keswick Island survey area.
The seagrass communities of the Keswick Island monitoring areas are dominated by the fast growing colonising species Halophila tricostata with occasional presence of H. decipiens.
The highest coverage of seagrass within the surveyed Keswick Island monitoring area was in 2017, at just over 35 percent. The offshore location of these seagrass meadows means that water quality often returns to favourable conditions after a significant weather event much sooner than their inshore counterparts. This makes them less susceptible to turbid coastal runoff and flooding from natural events such as cyclones and high rainfall.
Seagrass density can be an important indicator of the health of a seagrass community. Denser seagrass communities can provide more complex habitat structure and protection for animals that use them as nursery grounds, and may also provide more food for turtles, dugongs and other marine animals.
In our monitoring areas, density is a representation of the above ground biomass of seagrass within each monitoring area.
Cyclones can cause a range of weather conditions that influence which species become dominant and therefore, affect density levels.
This chart shows annual data for every year when we have been able to conduct density surveys in the area.
As noted above, the offshore position of Keswick Island’s seagrass communities means that they are less susceptible to major water quality events from the mainland and therefore have shown generally stable area (extent) recorded in the above chart.
The density chart to the right, provides more insight into the potential effects of cyclonic events on these seagrasses, even where overall area (extent) is maintained or expanded.
You can see more analysis on the data in these reports. You can also download the data used to create this chart.
All data presented on this page has been compiled using data collected by James Cook University on behalf of North Queensland Bulk Ports. Every effort has been made to ensure its accuracy; however, errors can occur. If you notice anything that looks incorrect, please feel free to contact us to let us know. We will always do our best to rectify any errors as soon as we are aware of them.
Seagrass surveys are conducted during every growing season and we aim to upload new seagrass data for the prior year by the second quarter of each subsequent calendar year.