Coral monitoring
We have monitored coral within the Great Barrier Reef World Heritage Area with James Cook University since 2006. Coral communities are a critical coastal marine habitat and a key indicator of overall marine health. We currently survey over 1.7km of paths each year across five inshore islands near our three east coast ports.
In the dashboard below you can view coral data from the past ten years.
We monitor diversity and abundance of corals and algae; extent of juvenile recruitment (baby corals); and indicators of coral health such as incidence of bleaching, disease and sediment deposition. This long-term data set can be used to help understand the dynamics and resilience of inshore coral communities and to support coastal resource management of our waterways.
Our annual coral surveys are undertaken by scientists at James Cook University (JCU). Through JCU and NQBP's higher education partnership, our monitoring program has the potential to support wide-ranging research opportunities.
Our coral data also feeds into broader Great Barrier Reef and regional report cards, including the Healthy Rivers to Reef Report Card, which measure the inshore health and resilience of coral communities and define their regional condition across catchments. You can read more on how we monitor coral including how divers collect data.
More information on the broader reef health is available at the Great Barrier Reef Marine Park Authority website.
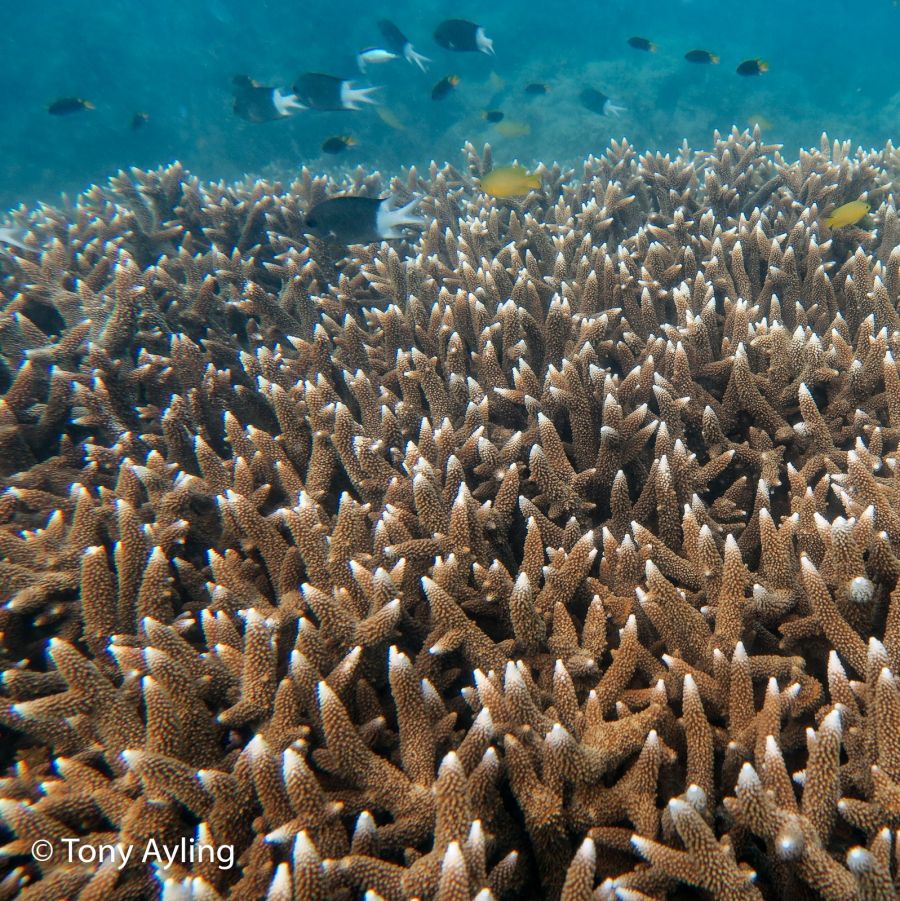
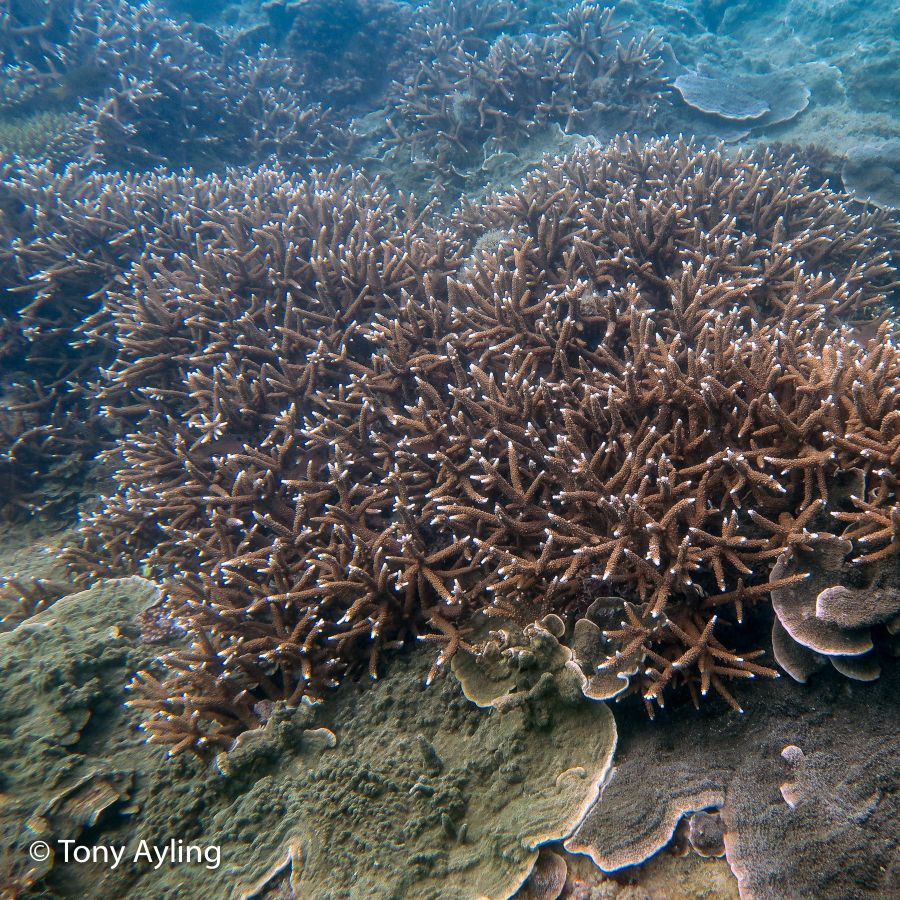
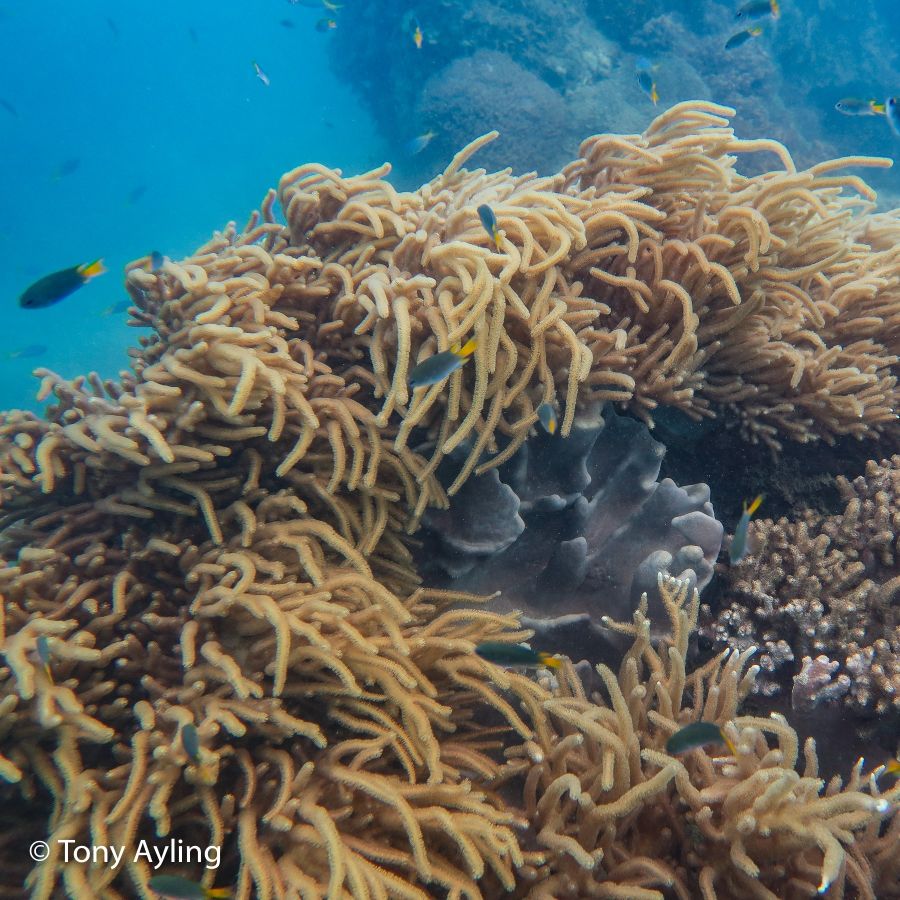
What makes up a coral community
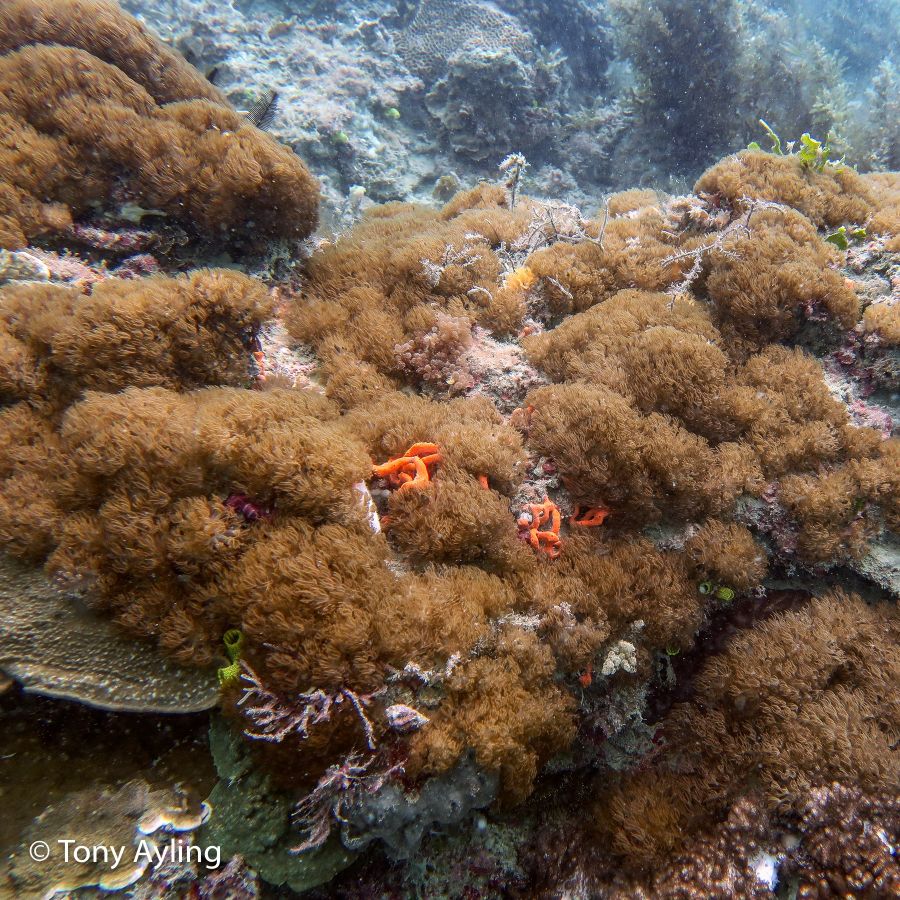
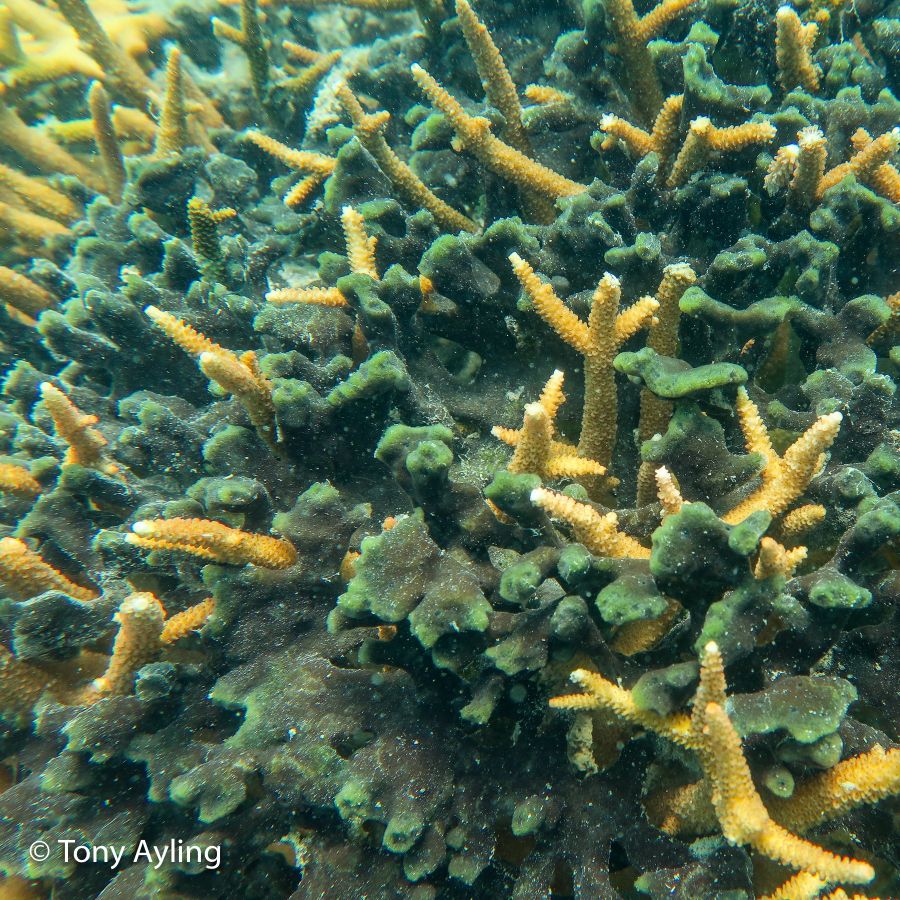
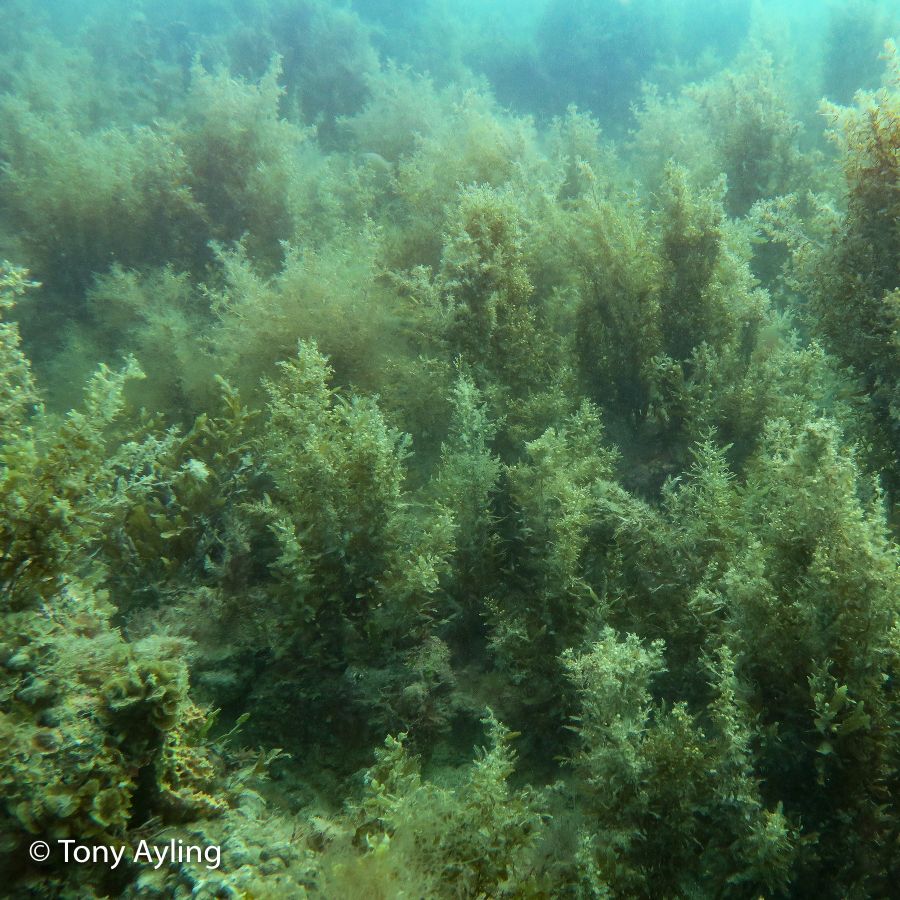
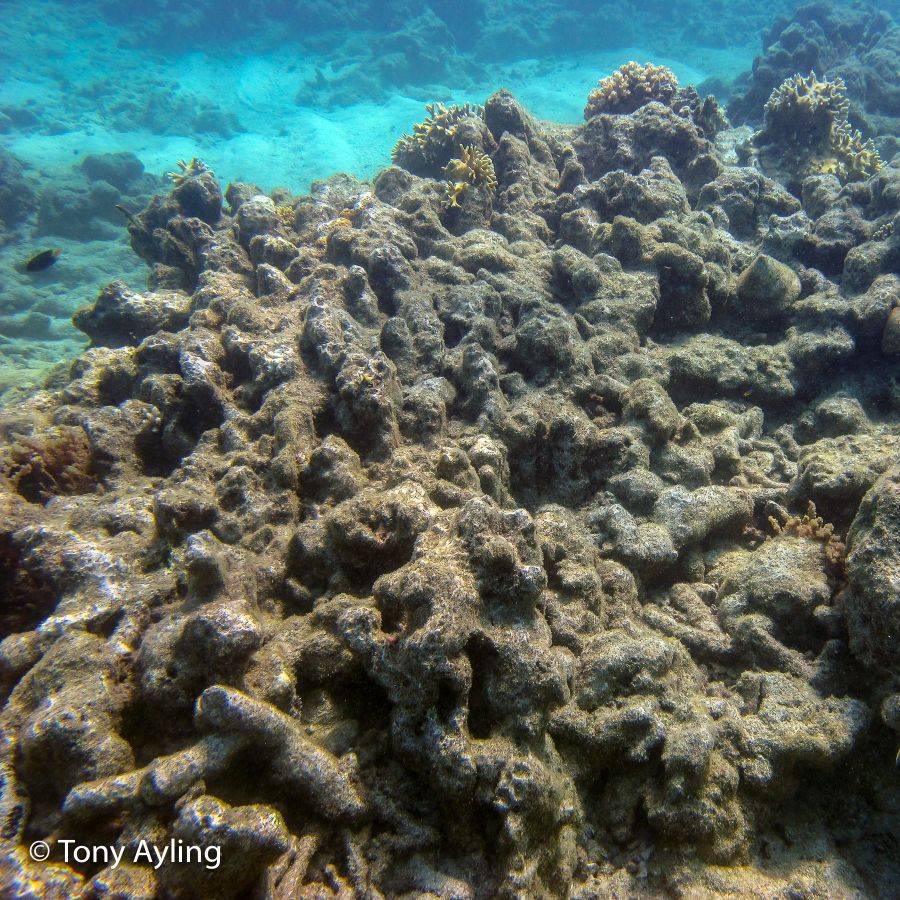
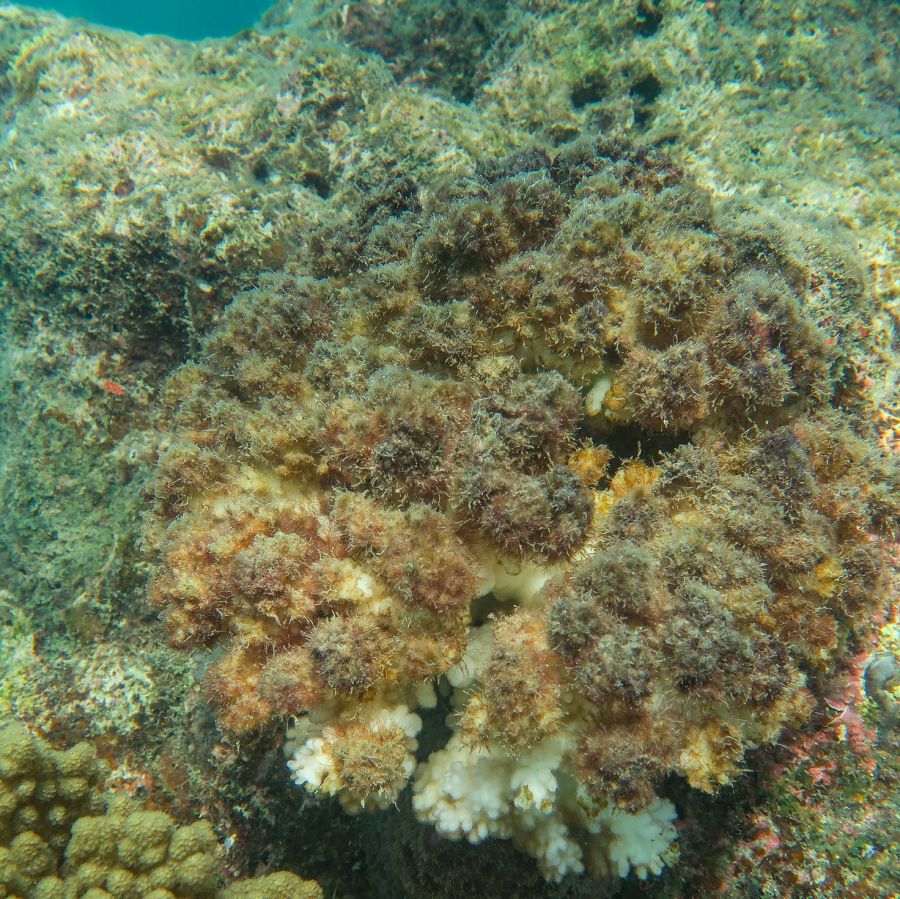
At each of our monitoring sites, benthic (seafloor) cover is classified into categories of cover type. The data we collect here provides information on the dominant reef structure (hard or soft), as well as the extent of macroalgae and sponges. Knowing the proportion of macroalgae and sponges is important for understanding the condition of the coral community.
Click on the images to learn more about the different coral and other cover types.
-
We survey transects (paths) across each of our island communities in the Mackay and Hay Point region, both pre and post-wet season. The inshore communities have been monitored since 2006. Keswick Island monitoring was also completed from 2015 until 2020. Data confirmed this location as more representative of mid-shelf reefs compared to inshore coral communities, the focus of our regular monitoring program. At each transect, benthic (seafloor) cover is classified into categories of cover type and provides information on the dominant reef structure (hard or soft coral), as well as the extent of macroalgae, which can impede the growth of corals. Information on the extent of bleached, diseased or damaged corals is also determined, which provides information on the health of the coral community. Click below on each monitoring location.
Four cyclone and extreme tropical low weather events impacted these inshore island locations in the years leading up to 2025. Read more on extreme weather impacts on the coral near our ports. In this same period, these locations have also experienced two GBR-wide bleaching events aligning with accumulated sea surface temperature peaks. More information on the broader reef health and coral bleaching is available at the Great Barrier Reef Marine Park Authority website.
1. Y-axis max differs between indicators of health and benthic composition charts.2. SEs (standard errors) can be accessed in the full reports on our reports and research page.3. Indicators of health chart represents pre-wet survey dates only, full survey data can be found in reports download.4. Small sponge readings up to approx 0.3 % may not be visible. Please refer to the downloadable data file. 5. An adjusted monitoring program design was implemented in Oct 2020 at Holbourne Island, resulting in a rearrangement of site locations to provide a more representative spread of coral cover and community assemblage. Pre-October 2020 results shown in graphs are therefore not directly comparable and may show increased variability in trends initially. Further details of these changes can be seen in the full reports.6. This same review (Oct 2022) resulted in a reduction from 6 to 4 sites per island for Hay Point and Mackay. Pre-October 2020 results shown in graphs will therefore not be directly comparable however this is not considered to have a measurable impact for the purpose of this display.7. Monitoring at Keswick Island ceased in 2020 after data confirmed this location as more representative of mid-shelf reefs compared to inshore coral communities.Coral and Benthic Cover at Hay Point & Mackay
Inshore corals and benthic (sea floor) cover are, to an extent, naturally acclimatised to greater frequency and scale of disturbances like cyclones, high water temperatures, and freshwater influx and elevated turbidity (sediment in water) from flooding compared to their more offshore counterparts. Measuring coral cover, alongside diversity, juvenile recruitment, and bleaching and disease, can help us to understand the typical degree of change in these communities, anticipate recovery potential and timeframes from such disturbances.
What the chart shows
Over the past 12 months, hard coral cover has continued to increase in the three inshore locations following the major 2020 disturbance of accumulated sea surface temperature heat stress at the GBR-wide scale in 2020. This potential recovery is a positive outcome over only a few years following such a large-scale disturbance at these locations.
Over the last decade, hard coral cover has fluctuated with some losses across locations after both the 2017 TC Debbie and the 2020 heat stress event, however, recovery gains since then have held at both Round Top and Victor Island with 31% and 29% hard coral respectively. Slade Island, with 27% hard coral cover, is also showing good recovery since 2020 diebacks.
Read more on cyclone impacts on the coral near our ports. You can see more analysis on the data in these reports.
Hard coral cover at Hay Point & Mackay
1. Y-axis is dynamic and therefore differs between each tab.2. SEs (standard errors) can be accessed in the full reports on our reports and research page.3. Pre and post wet season annual surveys commenced in 2015.4. Holbourne Island sites were rearranged in October 2020 therefore prior results shown in graphs are not directly comparable and may show increased variability in trends initially. Further details of these changes can be seen in the full reports.5. This same review (Oct 2022) resulted in a reduction of sites per island for Hay Point and Mackay. Pre-October 2020 results shown in graphs will therefore not be directly comparable however this is not considered to have a measurable impact for the purpose of this display.What the chart shows
Soft corals have never been common in the inshore islands monitored (historically ranging from 2% to 10% of cover); however, they have consistently been significantly more abundant on Round Top and Keswick. Being a mid-shelf reef, Keswick has since been removed from the monitoring program however Round Top remains the most abundant for soft corals, these most recently accounting for 15% of cover.
This coverage represents an increase since the declines observed in 2020 that aligned with GBR region-wide accumulated sea surface temperature peaks. Slade and Victor Islands have also maintained small to minor increases, with cover most recently at 3.5% and 2.6% respectively. Read more on cyclone impacts on the coral near our ports. You can also see more analysis on the data in these reports.
Soft coral cover at Hay Point & Mackay
1. Y-axis is dynamic and therefore differs between each tab.2. SEs (standard errors) can be accessed in the full reports on our reports and research page.3. Pre and post wet season annual surveys commenced in 2015.4. Holbourne Island sites were rearranged in October 2020 therefore prior results shown in graphs are not directly comparable and may show increased variability in trends initially. Further details of these changes can be seen in the full reports.5. This same review (Oct 2022) resulted in a reduction of sites per island for Hay Point and Mackay. Pre-October 2020 results shown in graphs will therefore not be directly comparable however this is not considered to have a measurable impact for the purpose of this display.What the chart shows
The extreme cyclonic weather events over the last decade not only had significant effects on hard coral cover but also preceded a marked increase in macroalgae at all locations. In contrast, macroalgae at all locations declined during the 2020 region-wide accumulated heat stress event. Macroalgae at Round Top Island and Slade Island, while fluctuating seasonally, have since maintained significantly lower coverage.
From summer 2015 to 2025 macroalgae decreased from 24% to 0.96% on Round Top Island and similar coverage to the 2006 & 2007 baseline surveys. In contrast, while Victor Islet coverage has shown sharp reductions after cyclone or heat stress events, this rebounds with consistently higher coverage over time, increasing from 29% to 31% between 2015 and 2025.
You can see more analysis on the data in these reports.
Macroalgae cover at Hay Point & Mackay
1. Y-axis is dynamic and therefore differs between each tab.2. SEs (standard errors) can be accessed in the full reports on our reports and research page.3. Pre and post wet season annual surveys commenced in 2015.4. Holbourne Island sites were rearranged in October 2020 therefore prior results shown in graphs are not directly comparable and may show increased variability in trends initially. Further details of these changes can be seen in the full reports.5. This same review (Oct 2022) resulted in a reduction of sites per island for Hay Point and Mackay. Pre-October 2020 results shown in graphs will therefore not be directly comparable however this is not considered to have a measurable impact for the purpose of this display. -
1. Please note y-axis max differs between indicators of health and benthic composition charts.2. SEs (standard errors) can be accessed in the full reports on our reports and research page.3. Indicators of health chart represents pre-wet survey dates only, full survey data can be found in reports download4. Note: Small sponge readings up to approx 0.3 % may not be visible. Please refer to the downloadable data file.
We survey transects (paths) across each of the two island communities in the Abbot Point region. At each transect, benthic (seafloor) cover is classified into categories of cover type and provides information on the dominant reef structure (hard or soft), as well as the extent of macroalgae, which can impede the growth of corals. Information on the extent of bleached, diseased or damaged corals is also determined, which provides information on the health of the coral community. Click below on each site.
Coral and Benthos Cover at Abbot Point
Inshore corals and benthic (seafloor) cover are, to an extent, naturally acclimatised to greater frequency and scale of disturbances like cyclones, high water temperatures, and freshwater influx and elevated turbidity (sediment in water) from flooding compared to their more offshore counterparts. Measuring coral cover, alongside diversity, juvenile recruitment, and bleaching and disease, can help us to understand the typical degree of change in these communities, anticipate recovery potential and timeframes from such disturbances.
What the chart shows
Surveys at Abbot Point commenced in 2016. A clear impact from Tropical Cyclone Debbie was shown 18 months later at Holbourne Island, which was most affected, given the cyclone's trajectory. Holbourne Island has struggled to recover from these impacts, alongside growing crown-of-thorns starfish predation pressures.
Holbourne Island sites were revised in 2020 and therefore trends shown are not temporally comparable. Nonetheless, changes observed since October 2020 show stable hard coral cover at all Holbourne Island sites.
Camp Island hard coral communities, in comparison, were somewhat protected by the angle of approach of Tropical Cyclone Debbie and showed strong recovery since 2017. The 2020 summer bleaching event however was found to significantly affect corals at all sites, with close to 40% of corals bleached and a high percentage of mortality at Camp Island (cover reduced from 24% to 6% from October 2019 to October 2020). Signs of recovery at Camp Island have since been observed, with most recent surveys having hard coral at 18%.
You can see more analysis on the data in these reports.
Hard coral cover at Abbot Point
1. Please note y-axis is dynamic and therefore differs between each tab.2. SEs (standard errors) can be accessed in the full reports on our reports and research page.What the chart shows
Surveys at Abbot Point commenced in 2016. A clear impact from Tropical Cyclone Debbie was shown 18 months later at Holbourne Island, which had approximately 14% soft coral cover prior to this and has struggled to recover, most recently recording 5% soft coral cover.
Camp Island communities however have never recorded high percentages of soft corals, covering less than 1%.
You can see more analysis on the data in these reports.
Soft coral cover at Abbot Point
1. Please note y-axis is dynamic and therefore differs between each tab.2. SEs (standard errors) can be accessed in the full reports on our reports and research page.What the chart shows
Holbourne Island is a more mid-shelf location than Camp Island. In part due to its location, Holbourne Island has never shown levels of macroalgae >1%. Cover during the most recent pre-wet surveys was 0.75%.
Camp Island, by comparison, has consistently had much higher macroalgae cover, 36% during the same recent survey period. These high macroalgae levels are thought to be influenced by seasonal nutrient fluctuations. The peak of 76% in October 2020 followed the GBR region-wide accumulated heat stress event of early 2020. In the Mackay and Hay Point region macroalgae was seen over this same period to decline significantly except for Sargassum spp., the predominant macroalgae at Camp Island.
While Camp Island coral communities have historically been more susceptible to the stress-related bleaching from high water temperatures and competition for space with macroalgae, the main influences on coral health at Holbourne Island are predation by sea snails (Drupella) and crown-of-thorns starfish.
You can see more analysis on the data in these reports.
Macroalgae cover at Abbot Point
1. Please note y-axis is dynamic and therefore differs between each tab.2. SEs (standard errors) can be accessed in the full reports on our reports and research page.
Marine monitoring at NQBP
We conduct a wide range of marine monitoring at our ports and in the surrounding Great Barrier Reef World Heritage Areas year-round.
Watch dive surveys in action
NQBP undertakes a comprehensive ambient marine monitoring program, looking at a variety of elements including seagrass, coral and water quality.
Extensive ambient marine environmental monitoring of water quality, coral and seagrass by our environmental partners James Cook University and TropWATER assist us to ensure risks to the environment are managed and ship trade continues in and out of our ports.
Watch JCU scientists in action on the reef while completing monitoring in our Port waters off Mackay.