Understanding coral monitoring
As part of our long-term environmental monitoring program, we conduct annual coral surveys in the areas surrounding each of our east coast ports.
Our coral data for the past ten years is available to view and download via our coral dashboard.
We monitor a range of coral indicators, including diversity and abundance of corals and algae; extent of juvenile recruitment (young, new corals); and other indicators of coral health such as incidence of bleaching, disease, predation and sediment deposition.
Our coral data also feeds into broader Great Barrier Reef and regional report cards including the Healthy Rivers to Reef Report Card which measure the inshore health and resilience of coral communities and define their regional condition across catchments.
More information on the broader reef health is available at the Great Barrier Reef Marine Park Authority website.
Our surveys are undertaken by scientists at our research partner university, James Cook University (JCU). Our long-term data set, collected over many years of monitoring, can be used to help understand the dynamics and resilience of inshore coral communities and to support coastal resource management of our waterways.
You can also see more analysis on our coral data by downloading our full reports.
How we monitor coral
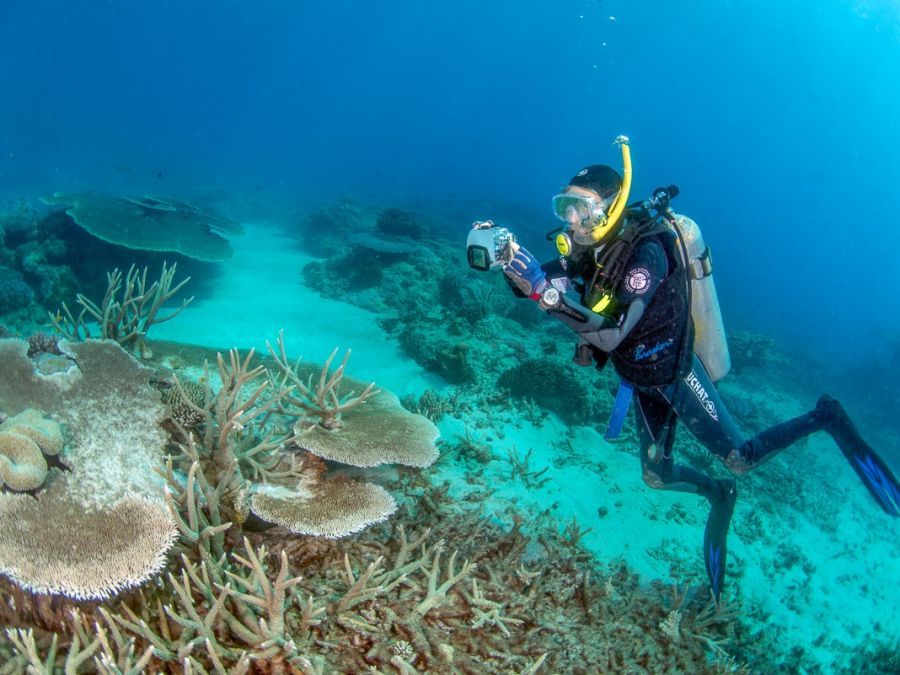
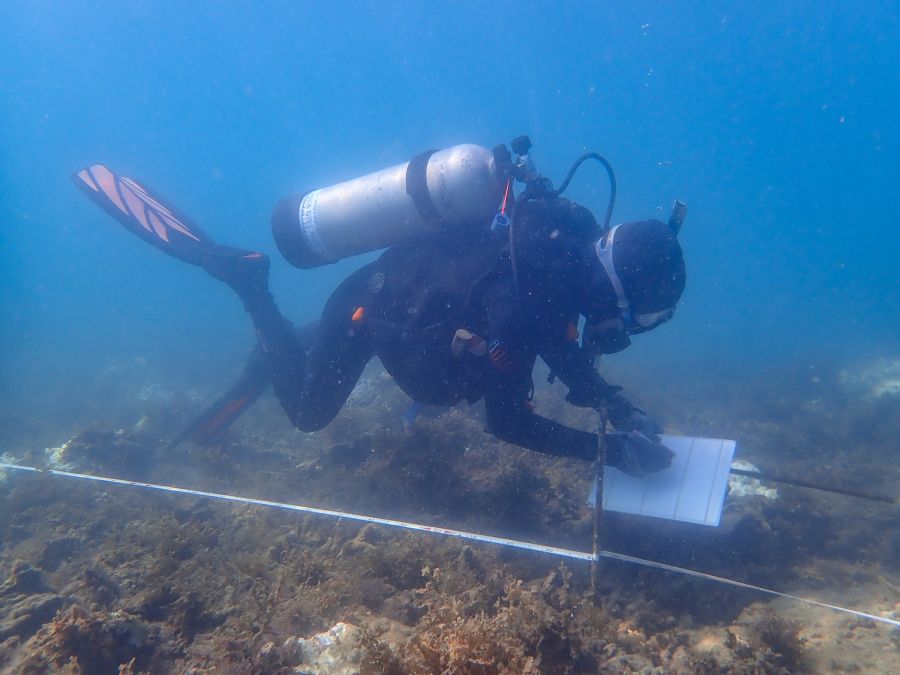
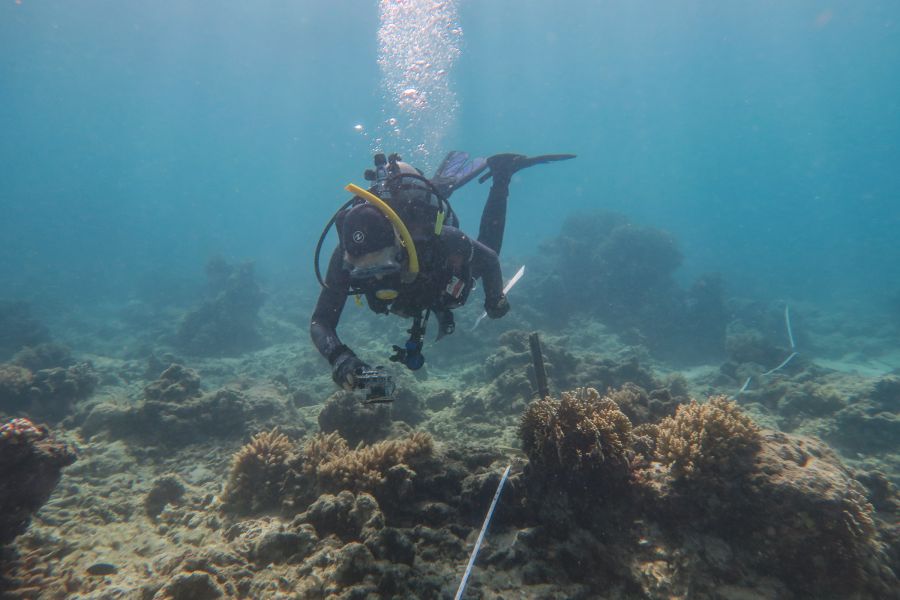
Our research partner, James Cook University (JCU), conducts one seasonal survey of coral each year. The surveys involve coral scientists diving at the same sites each time to detect changes in coral communities including indicators of health described below.
During these surveys, photographs are taken along each site (transects). Juvenile coral (young, new corals) numbers are recorded and coral health issues are noted such as bleaching, sediment deposition (cover) and any disease or predation. Additionally, scientists will record encounters with marine fauna which provides a greater understanding of the wider ecosystem. This can include sea snakes, star fish, sea cucumbers, reef sharks and fish species.

Indicators of health
We capture information on the extent of bleached, diseased, predated or damaged corals at each of our sites, otherwise known as indicators of health. This provides general information on the health of the coral community.
These indicators are driven by a variety of factors, such as climatic and extreme weather events, as well as other activities and contributors. As you will see when referring to our dashboard data, the readings can vary quite significantly from one year to the next.
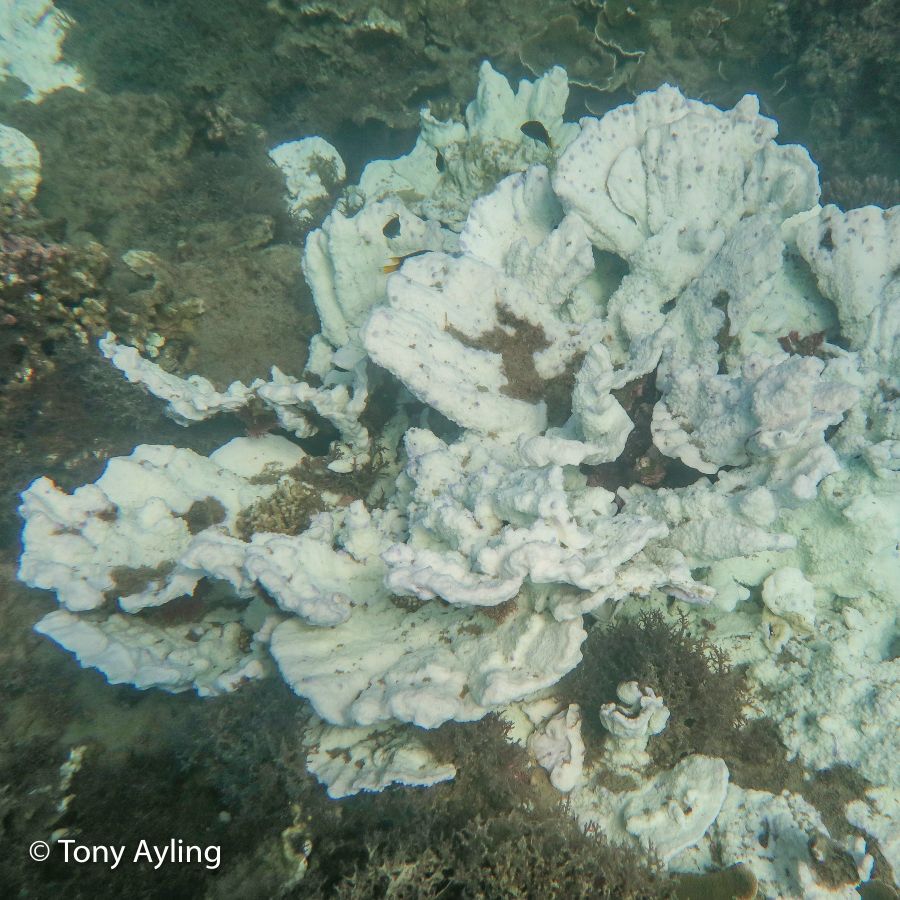
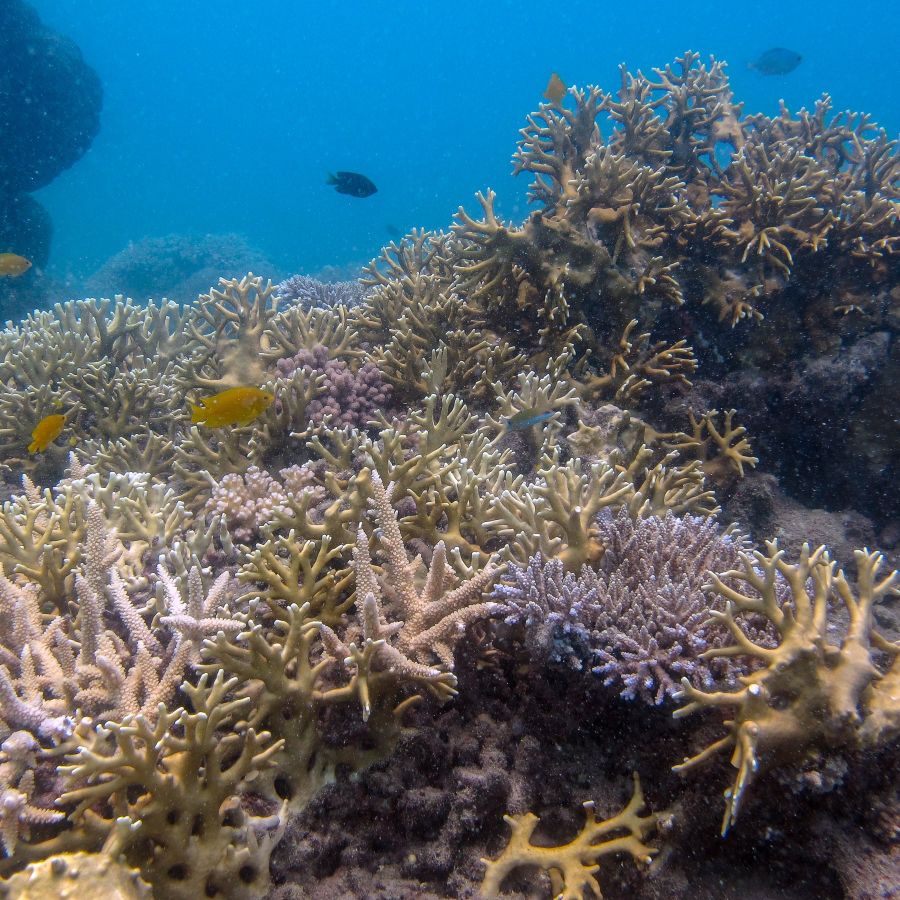
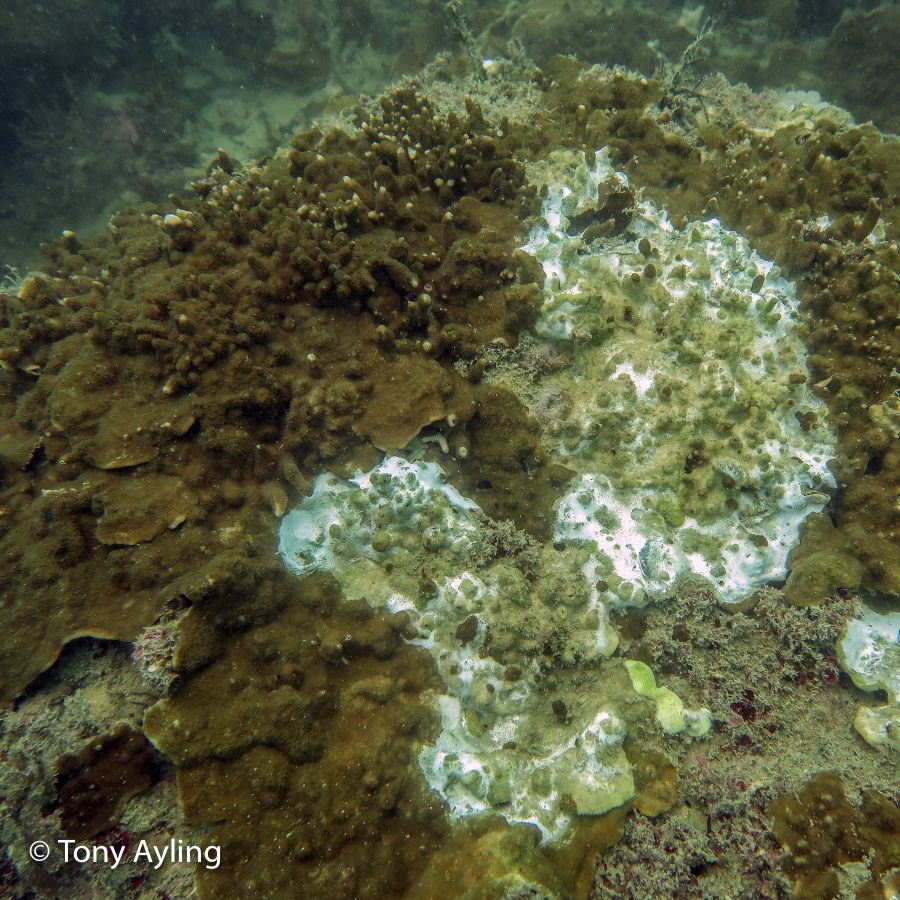
Stress factors may include temperature, wind-driven sediment re-suspension, light and changes in nutrient levels in the water. These can cause symbiont loss, turning corals white, as you can see in some of the images below. Bleaching events are becoming more prevalent throughout the Great Barrier Reef, and are associated with the extreme, and sustained, summer temperatures experienced in these north Queensland regions of late.
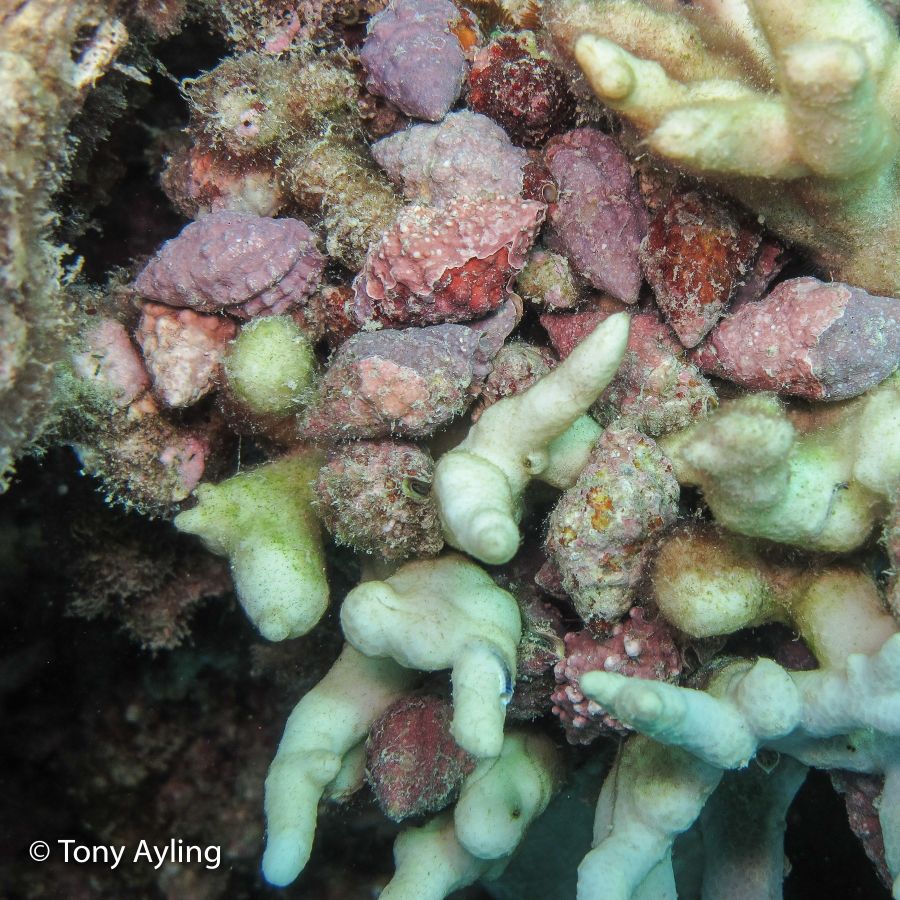
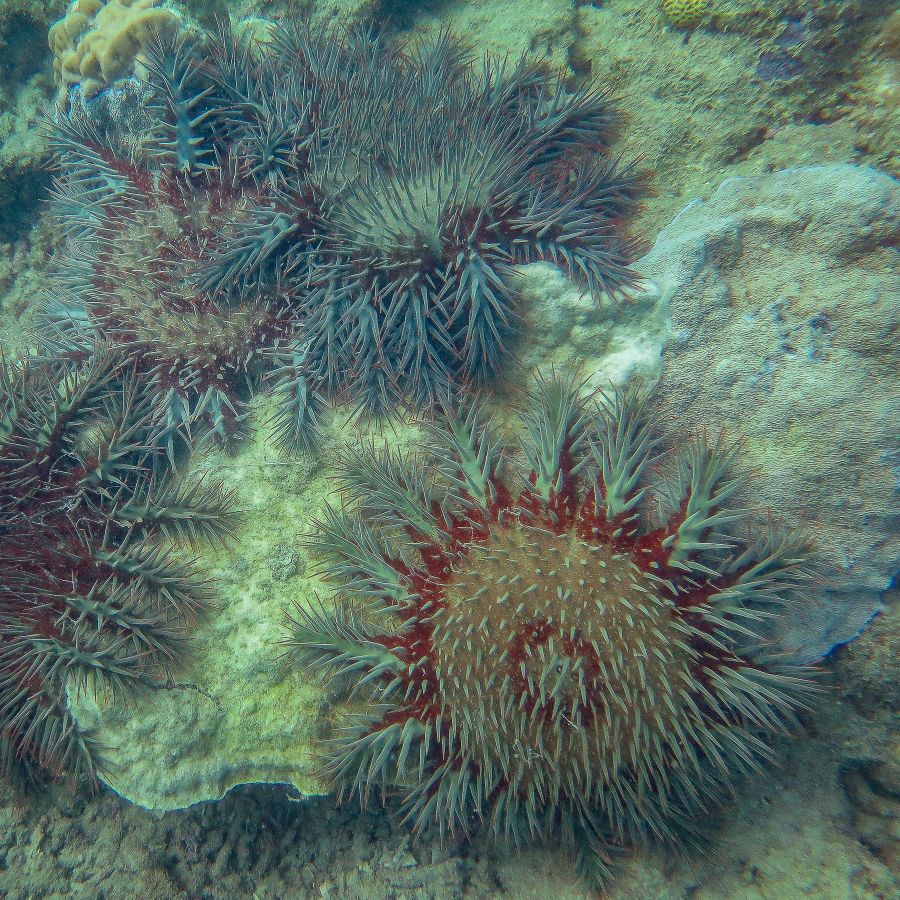
As indicated, corals are also subject to disease and damage, which can cause partial or total coral deterioration. Damage can be caused directly from diseases such as bacterial infections for example atramentous necrosis ("black lesions") or from direct predation, such as by crown of thorns starfish or Drupella snails.
Click on each of the images below to see examples of some of these indicators.
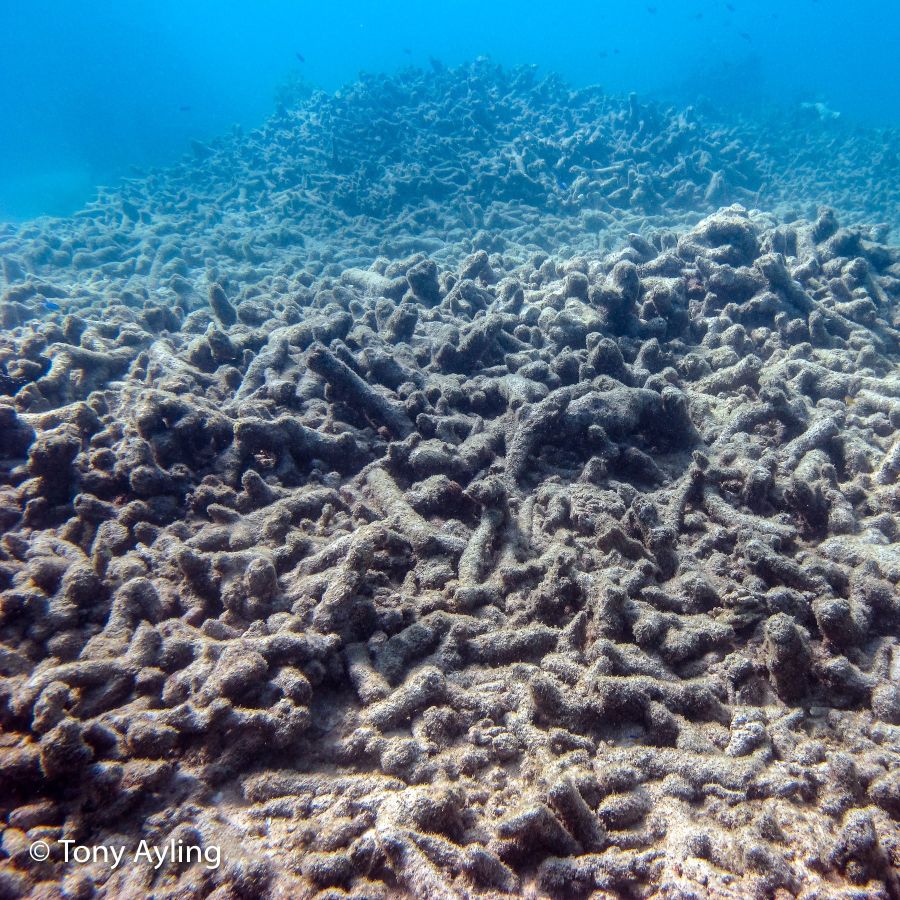
Cyclone and extreme weather impacts on coral
Cyclones and extreme weather cause very high winds and sea conditions. The power of cyclonic and exteme tropical low winds and waves can cause coral reefs to be torn, broken and dislodged, taking many years for corals to recover.
Queensland has experienced several cyclones and extreme weather events since 2010, the most significant of which are shown below, along with their category rating and details of the winds and waves generated. Below are links to the Bureau of Meteorology website and these cyclones are also referred to in our coral dashboard.
| Year | Cyclone | Category | Impact |
|---|---|---|---|
| May 2010 | Ului | 3 | Peak wind gust 290 km/h. Max Wave height 9.4 m (Mackay). More on Ului |
| Jan 2011 | Yasi | 5 | Peak wind gust 285 km/h. Max Wave height 9.6 m (Peak wave height recorded at Townsville). More on Yasi |
| Jan 2013 | Oswald | 1 | Peak wind gust 140 km/h. Max Wave height 5.57 m (Mackay). More on Oswald |
| Jan 2014 | Dylan | 2 | Peak wind gust 140 km/h. Max Wave height 9.98 m (Mackay). More on Dylan |
| March 2017 | Debbie | 4 | Peak wind gust 260 km/h. Max Wave height 8.69 m (Mackay). More on Debbie |
| April 2018 | Iris | 2 | Peak wind gust 150 km/h. More on Iris |